
Good morning,
Thousands of times I have changed colours in charts.
Suddenly today, the bar with the two colour editors disappears as soon as I click on a segment or column in a chart. It is replaced by another toolbar that is unusable to me.
I have searched for a long time, ‘repaired’ SoftMaker and reinstalled it completely, but nothing helps.
It may well be that it is due to a small setting or something I have done myself. It seems like something simple.
How can I change colours in charts again?
No longer able to change colours in charts

Re: No longer able to change colours in charts
Thank you for reporting the issue.
We’re currently unable to reproduce the problem, as we’re able to change the chart color without any difficulty. Could you please share a screenshot of the issue so we can investigate it further?
To change the color in the chart, right-click on the bar and select "Series Properties". Then go to the "Format tab" and, under the "Fill" section, choose your desired color.
Re: No longer able to change colours in charts
This is complete Spanish to me (I don't speak Spanish). Please explain. Which bar?SuperTech wrote: Wed Feb 18, 2026 1:10 pm To change the color in the chart, right-click on the bar and select **Series Properties**. Then go to the **Format** tab and, under the **Fill** section, choose your desired color.
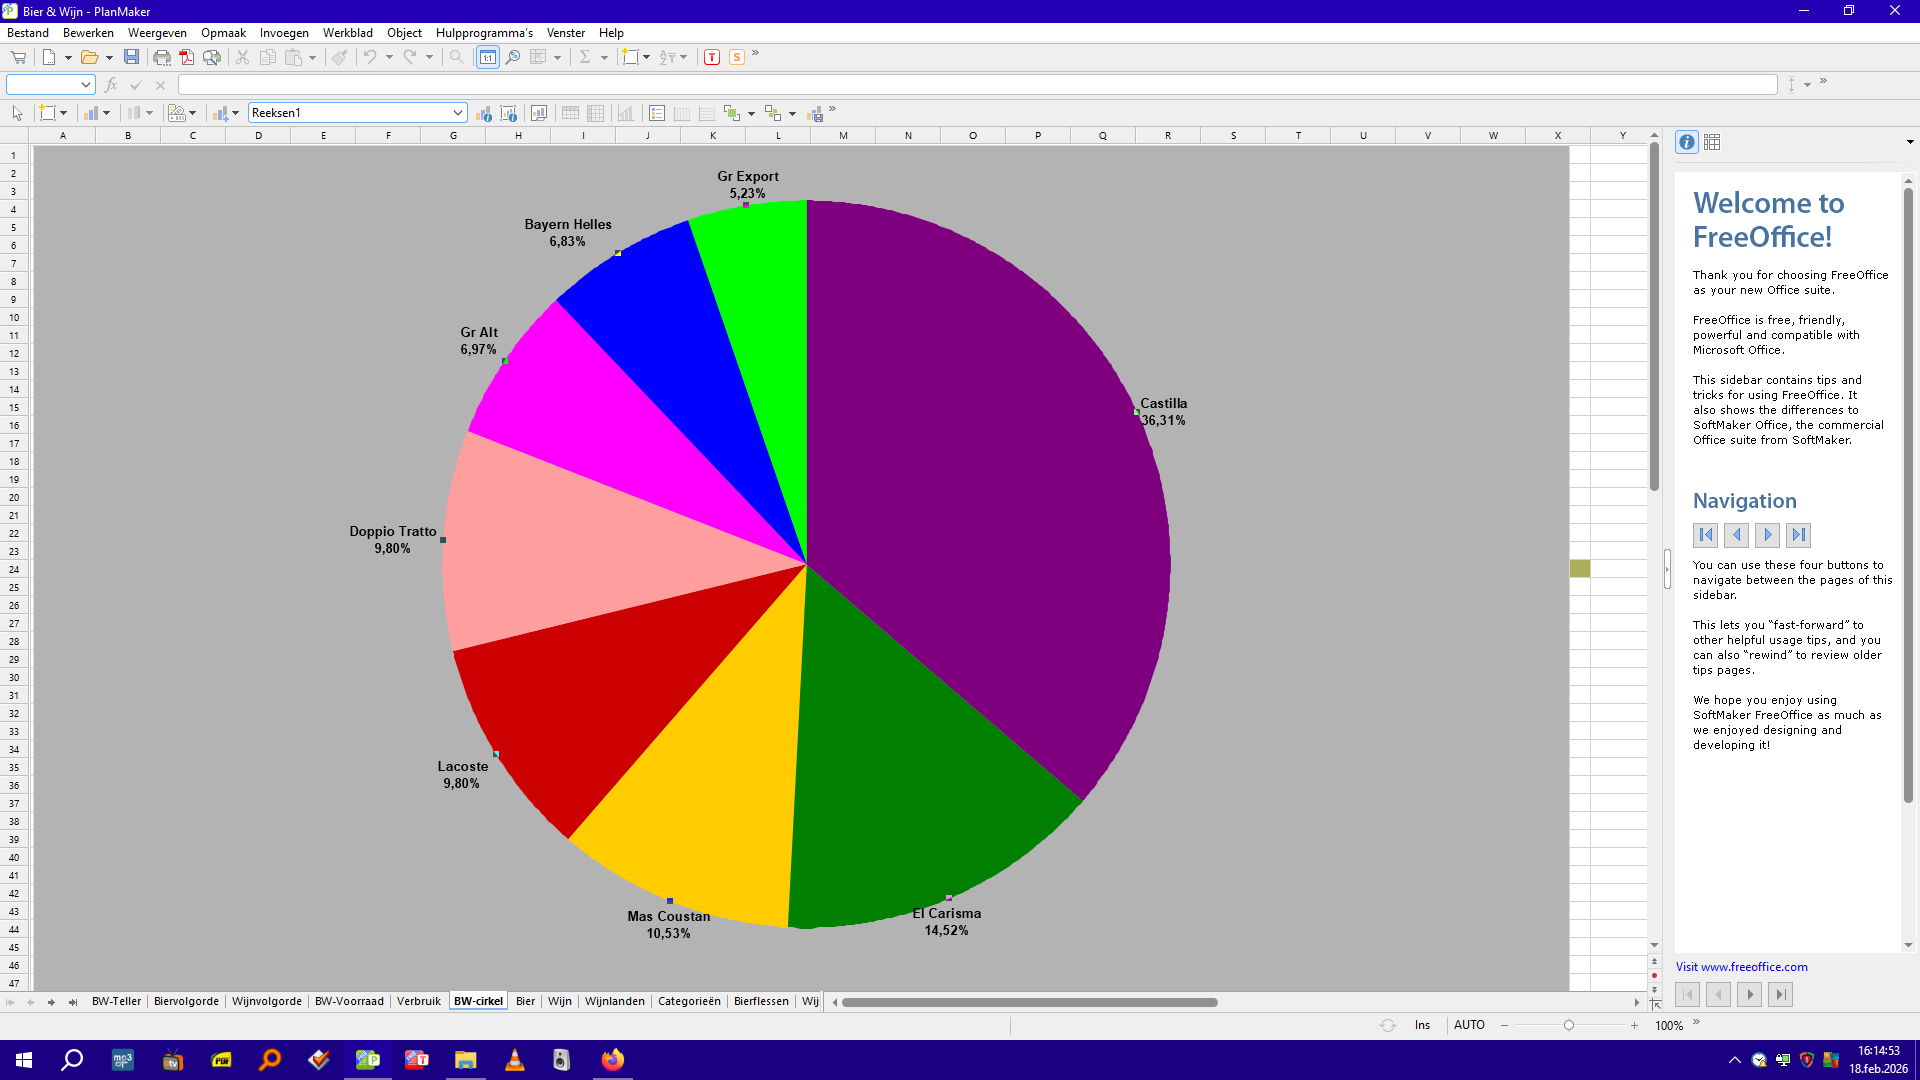
I'll place 2 screenshots: 1. Before and 2. After clicking on one of the colour fields.
In 2., after clicking on a colour section, the toolbar where the arrow points in 1. is gone.
1.

2.
Re: No longer able to change colours in charts
Thank you for sharing the screenshots.
Here’s what we observed:
Screenshot 1: The cursor is positioned on the sheet outside the chart. That’s why the formatting toolbar is visible—it applies to the sheet, not the chart.
Screenshot 2: The cursor is placed directly on the pie chart. As a result, the sheet formatting toolbar is not displayed.
If you would like to change the color of a slice in the pie chart, please follow these simple steps:
1. Select the desired slice of the pie chart.
2. Right-click on the selected slice.
3. From the “Chart fill color” dropdown menu, choose your preferred color.
Please check the below screen recording for your reference.
Re: No longer able to change colours in charts
Indeed I had changed the colour of a graph segment thousands of times. But after a two-month break, I had apparently forgotten how to do it.
After double-clicking on the segment (no right-click in my case), a window opens that I have indeed also seen thousands of times. The bar at the top plays no role here at all.
Problem solved!
I'm glad I said, ‘It may well be that it is due to a small setting or something I have done myself. It seems like something simple.’ Otherwise, I would be deeply ashamed.
After reinstalling SoftMaker, I also no longer knew how to pin documents to a jump list. I had to look that up too.
Apparently, computer knowledge evaporates as quickly as eau de cologne.
Thank you very much for your help, SuperTech!